Blank Portfolio Builder


Table of contents
The Settings box.
Status verification line
Verification box
Investment selection boxes
Purchase list
Concluding
A short introduction to the Blank Portfolio Builder
The settings box of the Blank Portfolio Builder tool is exactly the same as in the original ProfileBuilder. The differences lie in
The selection of direct investment lines becomes possible instead of being limited to the sample ETF catalog. This allows you to enter any instrument of your choice.
You provide all necessary data like name, price, currency, and ticker. Since the investment boxes are not pre-filled, each line has a price set at zero.
A “status line” is introduced below the Settings Box where you can see what still is missing where.
1 The Settings Box
Note : the light grey fields contain the settings you can change at any time.
LANGUAGE
Click in the language box and select the language of your choice.
Choices at launch are: Deutsch | English | Español | Français | Nederlands
Should you notice errors, it would be much appreciated if you let us know so in the contact form and how you think it should be. Corrections are easy to implement.
In case language is not in the choice list and you would like to see it added, feel free to leave a message in the contact form as well. If you agree, you’ll receive a list of terms (English being the base language) in order to translate to your language.
PROFILE
Dropdown menu: Defensive | Balanced | Dynamic
Click on the investor profile that applies to you.
IPB stands for Investment Porfolio Builder
If you are not 100% sure what investor profile you have you should do 2 things
Read the investor profile assessment tutorial
Do the assessment which is totally free (under “Tools” in the top menu bar.)
GDP Bias
Dropdown menu: 1 AMER | 2 EMEA | 3 APAC | 4 World
Select the world zone you live in, this adds GDP weight to that zone your are likely most familiar with
If you wish to have a non-biased global portfolio, then you can choose “World”
In this case the real GDP weight is applied to each of the 40 monitored countries.
REF CCY
Dropdown menu : Available currencies.
AUD - CAD - CHF - CNY - DKK - EUR - GBP - GBX (GBX = 0.01 GBP)- HKD - INR - JPY - KRW - NOK - NZD - RUB - SEK - SGD - TRY - USD - ZAR
This would be your reference currency,
Ref currency is the one you pay your bills in, or the one you use to calculate and compare performances.
This will then be used in all calculations further down the PortfolioBuilder template.
AMOUNT IN CCY
Simply enter the amount you want to invest in the reference currency you entered.
MAX per line
Dropdown menu: Percentages available in a 2.0% to 15.0% range.
Bear with me here, this may feel a bit counter-intuitive at first:
Smallest Max
The PortfolioBuilder automatically calculates the “smallest max” which you are allowed to enter in the MAX per line field. The “smallest max” is shown in the dark blue field at the bottom of the settings box, just under "Max per line".
You can set a maximum percentage that you accept per investment, but this choice must never be lower than the smallest max allowed.
Max per line
You can set a maximum percentage per individual investment line that you allow in the “MAX per line” field.
However, if you set this variable below the “smallest max”, you’ll be immediately notified with an INCREASE % message. Simply choose a percentage that is above the “smallest maximum”.
Otherwise, the form will not produce correct distribution results.
Function of this is that
a higher "allowed maximum" per line results in less ‘resolution’, i.e. less individual lines
a lower "allowed maximum" gives you a higher 'resolution', meaning more individual investment lines as a result (and a more diverse purchase list).
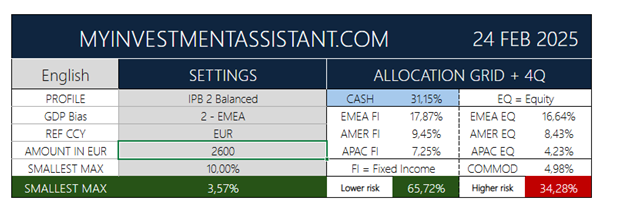
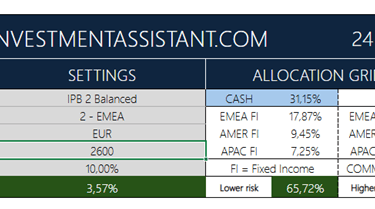
ALLOCATION GRID
Asset Allocation & risk numerical displays
PortfolioBuilder automatically produces the resulting Asset Allocation Grid
Left side shows the “lower risk” percentage, i.e. the sum of all cash and fixed income
Right side shows he “higher risk” percentages, i.e. the sum of equities and commodities.
2 The Status Verification Line
This at first sight mysterious line tells you which investment choices you still need to complete and in which investment box something is missing.
Let’s take the example line below: Please Complete >>
[1xEMEA FI] + [1xAMER FI] + [1xAPAC FI] + [1xEMEA EQ] + [2xAMER EQ] + [1xAPAC EQ]+ [1xCOMMOD]
This sample Status Verification Line reads as follows:
1xEMEA FI = 1 Fixed Income investment in the EMEA zone
1xAMER FI = 1 Fixed Income investment in the AMER zone
1xAPAC FI = 1 Fixed Income investment in the APAC zone
1xEMEA EQ =1 Equity (shares) investment in the EMEA zone
2xAMER EQ =2 Equity (shares) investment in the AMER zone
1xAPAC EQ = 1 Equity (shares) investment in the APAC zone
1xCOMMOD = 1 Commodities investment (worldwide)
When you start completing the investment boxes, and sufficient lines are chosen for a given category and zone, you will see that the status line automatically adapts and no longer shows missing investments for that given zone.
3 The Verification Box
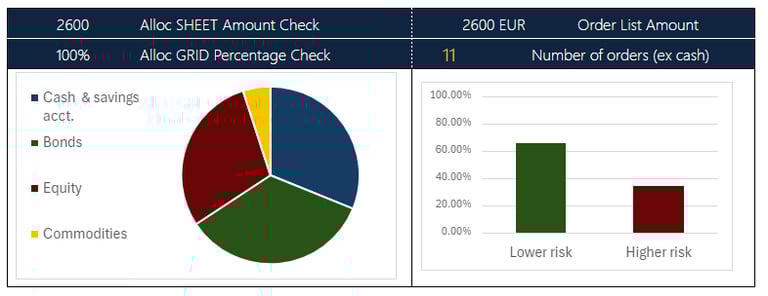
Here you can verify a few basics in a glance:
Do all numbers add up correctly?
Check the number of orders (investment lines) that was created.
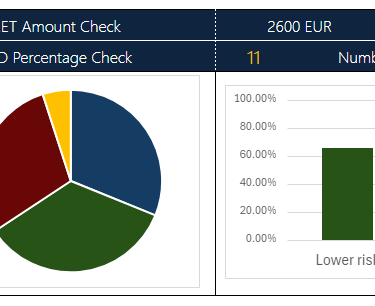
Visual : a pie-chart visualizing weight per asset class
Visual : a basic bar chart showing distribution between lower and higher risk
The sample above corresponds to the input of the settings box above, for a 2600 EUR investible amount and an EMEA balanced investor profile, leading to 11 separate investment lines, which have been correctly completed in the so-called “investment boxes”.
Check List
Do the amounts (allocation sheet and order list) add up to the amount you wish to invest?
Do the amounts in the purchase list (order list) add up to the amount to invest?
Does the allocation percentage check add up to 100?
The orange figure is the number of individual investment lines you’ll find in the purchase list.
If you have a large “MAX per line” setting like e.g. 10%, the number of lines will be relatively low.
If on the contrary you reduce the “MAX per line” setting, your purchase list will be a bit longer (more lines).
Graphs
An asset allocation pie chart gives you a visual of applied asset allocation
A bar chart on the right visualizes basic risk distribution.
Green = lower risk
Red = higher risk.
Troubleshooting
In case the amounts in the control box are not identical, or the percentage check is not 100%, then
Check if your “Max per line” setting is higher than the “Smallest Max”
Check if you have chose sufficient investments . You can see this in the Status Verification Line as described above.
4 The investment selection boxes
Here we go next level and you choose and enter the investments of your choice. The blank allocation form no longer contains pre-populated investment lines, but requires you to fill in a number of basic investment data in the light grey input fields.
This tool is not intended for beginner level, but requires at the very least a decent understanding of investment instruments. Do not buy what you do not understand!
TIP : be aware that if you leave that webpage, the information you already entered is not saved. So pay attention to stay within the tool until fully completed.
What remains the same?
The number of required lines per asset class per geographic zone still is pre-calculated and shows up in orange on top of each box. The EMEA Bonds selection box for instance needs just 1 investment in this case, up to you to choose which bond (ETF/Mutual Fund/direct bond line) you want.
Pre-fill of allocation percentages per asset class per geographic zone.
Cash is the first box on top of the template
Bonds (Fixed income) are the next 3 boxes
Shares (equities) follow with also 3 boxes
Commodities close the form with 1 box
Foreign exchange rates are applied automatically
Reference currency
The total amount per investment line in your reference currency is shown in the last column as a reference (less headaches and a form of control).
What is different ?
Individual investment lines are not pre-filled
Instead they contain a generic line like "EMEA Bond ETF" as a reminder which asset class is required in that investment selection box. As you can see above, the unit price is set at 0, which on purpose causes an error under "Quantity" to show that no investment was entered yet for that line. At the right hand side, you can see a total of 138.9 EUR, which corresponds to the amount needed to fill that line. Only the light grey fields are input fields!
You can enter direct investments, like:
Bonds
Shares
Mutual funds
ETF's and funds remain possible of course
With this total flexibility comes a much larger individual responsibility and increased need for doing own research. Again, this tool is not intended for beginners, but it can be very interesting to do 'dry runs' to practice first and see how your investment choices would have worked out !
You need to provide correct information yourself:
Name of your investment
TIP: add the ticker before or after the name for future reference.
Currency the security of your choice is quoted in
Price (last known and per unit) in the quotation currency
The system does the rest :
Calculate the counter value in your reference currency
Calculate the number of units (fractional) that are needed
Tickers no longer automatically appear.
The bank icon is no longer available.
The ETF Catalog Assistant
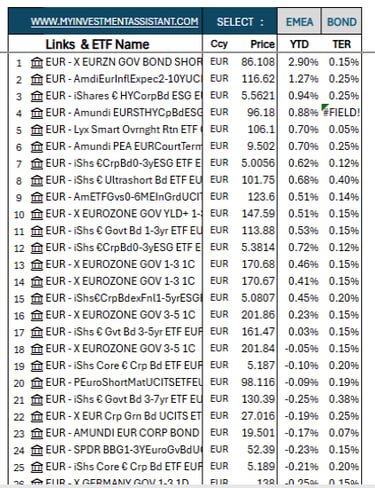
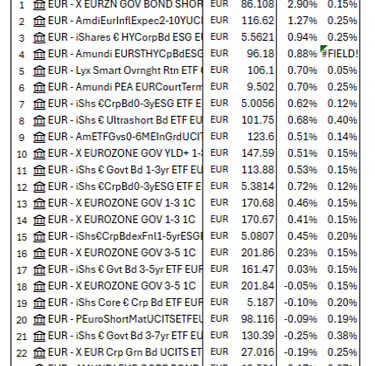
True, the bank icon is not directly available, but should you wish to browse the ETF catalog, the Catalog Assistant tool is on the same screen, still including the bank icon.
Imagine you wish to look into European Bond ETF's, then this assistant is the first go-to. At the top right you have two light-grey fields.
In the left one you select the zone (EMEA,AMER, APAC, Global)
In the right one you can select the asset class (Bond, Equity, Commodity)
Important: when investigating commodity ETF’s, you need to set the zone selection at “Global”.
This immediately gives you an overview of all the ETF’s in our (non-exhaustive) list, with the quotation currency, price, year-to-date performance and Total Expense Ratio at your fingertips as usual. And, cherry on the pie, you still have the “bank icon” allowing you to dig much deeper from here.
At this point you now should have correctly completed all required investment lines, the verification box adds up correctly, the Status Verification Line is empty and you can now verify the automatically generated purchase list.
Do stay on the same page in order not to loose your work!
5 The purchase list
After having entered
Your settings
Investor Profile
GDP bias
Reference Currency
Amount to invest
Maximum percentage of portfolio allowed per investment line
Your investment choices in all boxes
Your purchase list is automatically generated and/or updated. With this list you can either directly enter the purchases in your broker platform (if you’re a self-directed investor) or use it as a basis for work to discuss with your banker, broker or investment adviser.
Based upon your choices, you should get a purchase list similar to the one below. The original PortfolioBuilder tool generates a list with tickers in the last column, whereas the blank template does not. Hence the tip to put a ticker just before or after the name so that it shows up nevertheless.
At the very bottom of this purchase list, there is an ultimate check to verify if the numbers add up. In this particular case, you invest 1790 EUR out of the 2600 which was the investible amount you indicated in the settings box.
6 Concluding
The blank template
Applies the identical asset allocation process
Contains an assistant tool giving access to the ETF catalog
Allows you to enter other ETF’s than those in the catalog.
Allows you to enter individual investment lines (bonds, stocks or other)
Minimum required info for each of your chosen investments
Name
Quotation currency
Price
TIP: add the ticker at the end of the name for future reference.
WARNING regarding direct lines in fixed income:
Accrued interest for bonds is NOT automatically calculated.
Solution : add accrued interest (as a percentage) to the price
Practical example :
Given
A bond has an annual coupon of 6%
The client purchase price of this bond is 101.25 %
The last coupon was paid 9 months ago
Solution
Accrued interest = 6% x (9 months /12) = 4.5%
Bond Price of nominal = 101.25%
Total paid is 101.25% + 4.5% = 105.75%
Last but not least
It is without exaggeration crucial that you are always aware of, and adapt to, your local reality in order to know and correctly apply
Which ETF you can or cannot purchase
Which mutual fund you can or cannot purchase
Which bond you can or cannot purchase (e.g. restrictions for USA citizens with new bond issues)
Fiscal rules in your region, especially on capital gains taxes when you sell
Fiscal rules that apply in your region on fixed income (withholding taxes)
Fiscal rules that apply in your region on dividend payouts
Even in case of the slightest doubt, do not hesitate to consult your broker, bank, financial adviser, fiscal adviser, accountant, family office or any other qualified person or firm. What can help you too is that even before starting to select investments, you
Download an "approved ETF list" from your bank of broker platform
Obtain such a list from your account contact person.
This allows you to know if an ETF is
Registered for distribution where you live
Accepted where you hold your account.
A last word of encouragement
I know, that seems like quite a bit of work. Yes, it does take some of your time. Then again, that time and effort is one of the best investments you can make for and into yourself, and over time grow from beginner into intermediate level and, why not, be on your fascinating path towards becoming a well-versed investor. Be patient and time will be your friend..
Should you have any questions or concerns, do reach out and share these using the contact form.
Invest wisely & stay curious!
MY INVESTMENT ASSISTANT
IMPORTANT INFORMATION
Subscribe and get a free quickstart and clickable financial website list pdf
Empowering Investors with tools